Scalable Data Architecture from Streaming to Visualization
This tutorial outlines a comprehensive approach to constructing a scalable data architecture on UCloud, aimed at enabling real-time data analysis and visualization. It integrates NGINX for efficient data routing, Apache Spark for immediate data processing, PostgreSQL for reliable data storage, and Streamlit for interactive data visualization. The guide facilitates seamless integration of these technologies, ensuring smooth data flow from ingestion to actionable insights.
Architecture Overview: Scalable Data Pipeline
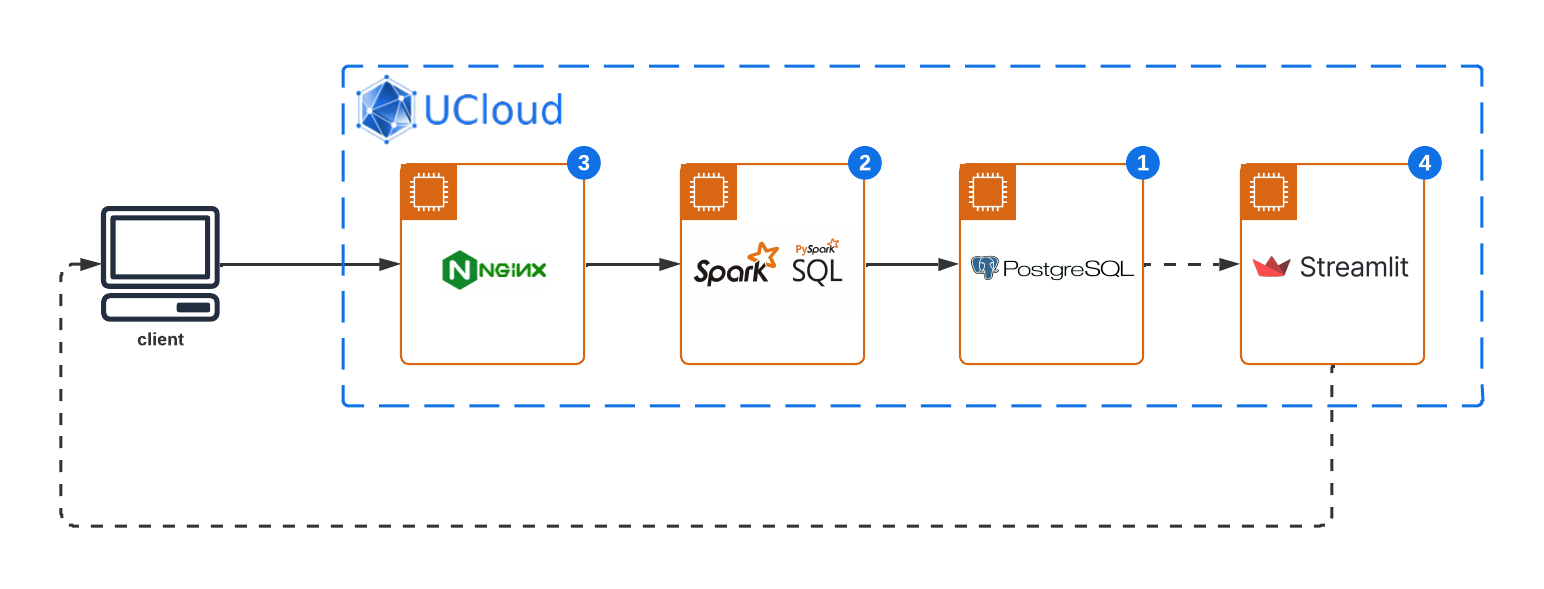
This sophisticated system architecture incorporates a series of robust technologies, each serving a pivotal role in the data processing and visualization pipeline. The primary components include:
NGINX Gateway: Acts as the frontline for data ingestion, efficiently routing incoming data streams to the processing layer. NGINX's robust capabilities ensure that data is securely and swiftly directed from external sources to the Apache Spark application for real-time processing.
Apache Spark: Positioned at the heart of this architecture, Apache Spark processes incoming data streams in real-time. Leveraging its in-memory computing capabilities, Spark performs complex analytics, including but not limited to anomaly detection, aggregation, and filtering, transforming raw data into structured insights.
PostgreSQL Database: Serving as the reliable data storage solution, PostgreSQL stores processed data, ensuring data persistence and integrity. This robust relational database system enables structured data storage, query optimization, and secure data access, forming the backbone of data warehousing within the architecture.
Streamlit Dashboard: The final layer of the architecture, it offers an interactive platform for data visualization, enabling end-users to explore processed data through intuitive interfaces. By pulling data from the PostgreSQL database, Streamlit dashboards can render dynamic visualizations, facilitating real-time data-driven decision-making.
Data Source: At the inception of the data pipeline lies a simulated data source, specifically designed to generate energy consumption data. This generator mimics real-world energy usage patterns, producing time-series data that reflects varying energy consumption levels over time.
This data architecture leverages UCloud scalable infrastructure and services, providing a cohesive environment for deploying and managing the integrated technologies. Through the integration of NGINX, Apache Spark, PostgreSQL, and Streamlit, this system architecture facilitates a streamlined pathway for data from its point of entry, through processing and storage, culminating in actionable visual insights.
PostgreSQL Setup: Configuring the Data Warehouse
Start by setting up your PostgreSQL database, preparing it to store data efficiently.
Database initialization
Launch a new PostgreSQL instance on UCloud. In this example we use the default settings for database name, user and password.
From the job terminal window access the PostgreSQL console:
$ psql
Tip
psql (16.2 (Debian 16.2-1.pgdg120+2))
Type "help" for help.
ucloud=#
Create a new table specifically designed to store detected anomalies:
CREATE TABLE anomalies (
    id SERIAL PRIMARY KEY,
    timestamp TIMESTAMP NOT NULL,
    energy_usage DOUBLE PRECISION NOT NULL,
    anomaly BOOLEAN NOT NULL
);
Spark Streaming Analysis: Real-time data processing
Set up a Spark standlone cluster on UCloud to handle the real-time processing of incoming data streams. Set the following optional parameters:
Number of nodes: 1
Connect to other jobs: Select the Job ID of the running PostgresSQL instance and specify a hostname.
Below we will assume postgres-server as the PostgresSQL hostname.
Establishing the data ingestion pathway
Open a terminal window on the Spark cluster master node, change to the imported Spark application directory, and initialize a TCP echo server to facilitate data ingestion from NGINX into Spark's processing environment.
# tcp_echo_server.py
import socket
import threading

def client_handler(client_socket, all_clients):
    try:
        while True:
            # Receive data from one client
            data = client_socket.recv(1024)
            if not data:
                break  # Client disconnected

            # Echo the received data to all connected clients (including Spark)
            for c in all_clients:
                try:
                    c.send(data)
                except:
                    pass
    finally:
        client_socket.close()
        all_clients.remove(client_socket)
        print("Client disconnected")

def start_echo_server(host='0.0.0.0', port=9999):
    all_clients = []
    server_socket = socket.socket(socket.AF_INET, socket.SOCK_STREAM)
    server_socket.bind((host, port))
    server_socket.listen(5)
    print(f"Echo server listening on {host}:{port}")

    try:
        while True:
            client_sock, addr = server_socket.accept()
            print(f"New connection from {addr}")
            all_clients.append(client_sock)
            # Handle each client connection in a new thread
            thread = threading.Thread(target=client_handler, args=(client_sock, all_clients))
            thread.start()
    finally:
        server_socket.close()

if __name__ == "__main__":
    start_echo_server()
By default the server listen to port 9999.
Ensure the server is active in the background to maintain a continuous data flow:
$ nohup python tcp_echo_server.py &
Spark application configuration
Develop and deploy a Spark application designed to analyze streaming data, identify anomalies, and persist these findings into PostgreSQL.
# app.py
from pyspark.sql import SparkSession
from pyspark.sql.functions import from_json, col, expr, to_timestamp
from pyspark.sql.types import StructType, StructField, IntegerType, StringType, DoubleType, TimestampType

# PostgreSQL connection details
url = "jdbc:postgresql://postgres-server/ucloud"
properties = {
    "user": "ucloud",
    "password": "ucloud",
    "driver": "org.postgresql.Driver"
}

table_name = "anomalies"

# Write the streaming DataFrame with anomalies to PostgreSQL using foreachBatch
def write_to_postgres(batch_df, batch_id):
    batch_df.write \
        .format("jdbc") \
        .option("url", url) \
        .option("dbtable", table_name) \
        .option("user", properties["user"]) \
        .option("password", properties["password"]) \
        .option("driver", properties["driver"]) \
        .mode("append") \
        .save()

if __name__ == "__main__":
    spark = SparkSession.builder.master("spark://node1:7077").appName("StreamingDetectionAnomaly").getOrCreate()

    # Define the schema of the incoming JSON data
    schema = StructType([
        StructField("timestamp", StringType(), True),
        StructField("energy_usage", DoubleType(), True),
    ])

    # Create DataFrame representing the stream of input lines from connection via the NGINX gateway server
    lines = spark \
        .readStream \
        .format("socket") \
        .option("host", "localhost") \
        .option("port", 9999) \
        .load()

    # Parse the lines of data into a DataFrame, and cast timestamp to TimestampType
    jsonData = lines.select(from_json(col("value"), schema).alias("data")).select("data.*") \
        .withColumn("timestamp", to_timestamp(col("timestamp"), "yyyy-MM-dd HH:mm:ss"))

    # Perform anomaly detection, here considering energy usage > 100 as an anomaly
    anomalies = jsonData.withColumn("anomaly", expr("energy_usage > 100"))

    # Write the anomalies to PostgreSQL
    query = anomalies.writeStream \
        .foreachBatch(write_to_postgres) \
        .outputMode("append") \
        .start()

    query.awaitTermination()
Execute the application, integrating PostgreSQL for data storage:
$ spark-submit --packages org.postgresql:postgresql:42.2.7 app.py
Hint
To keep the app running after closing the terminal window, run the command above in a screen or tmux session.
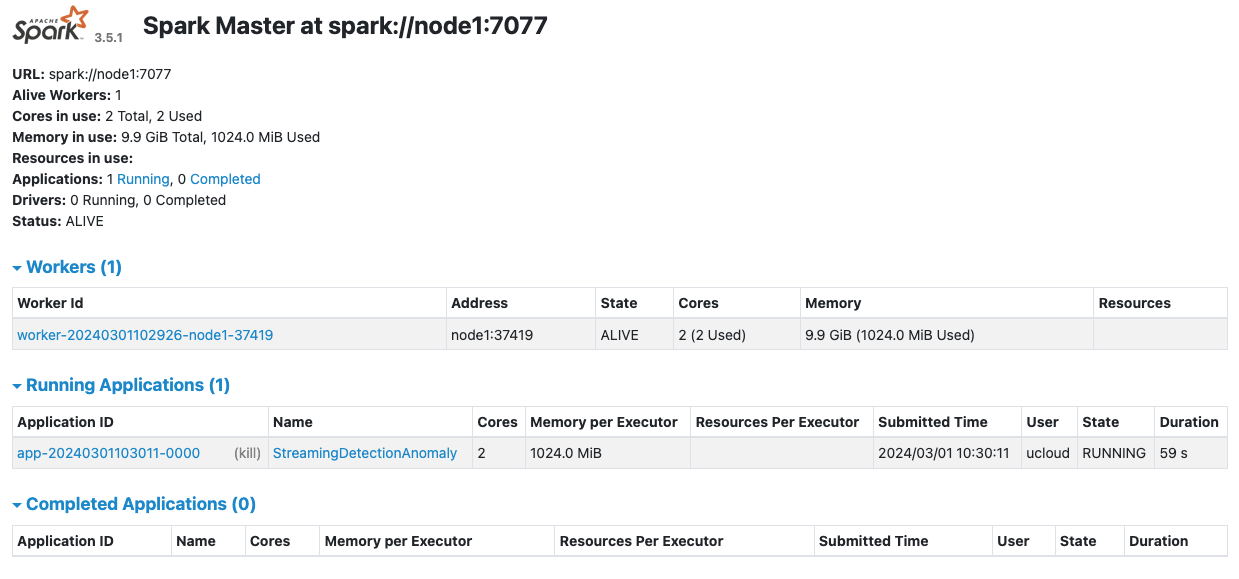
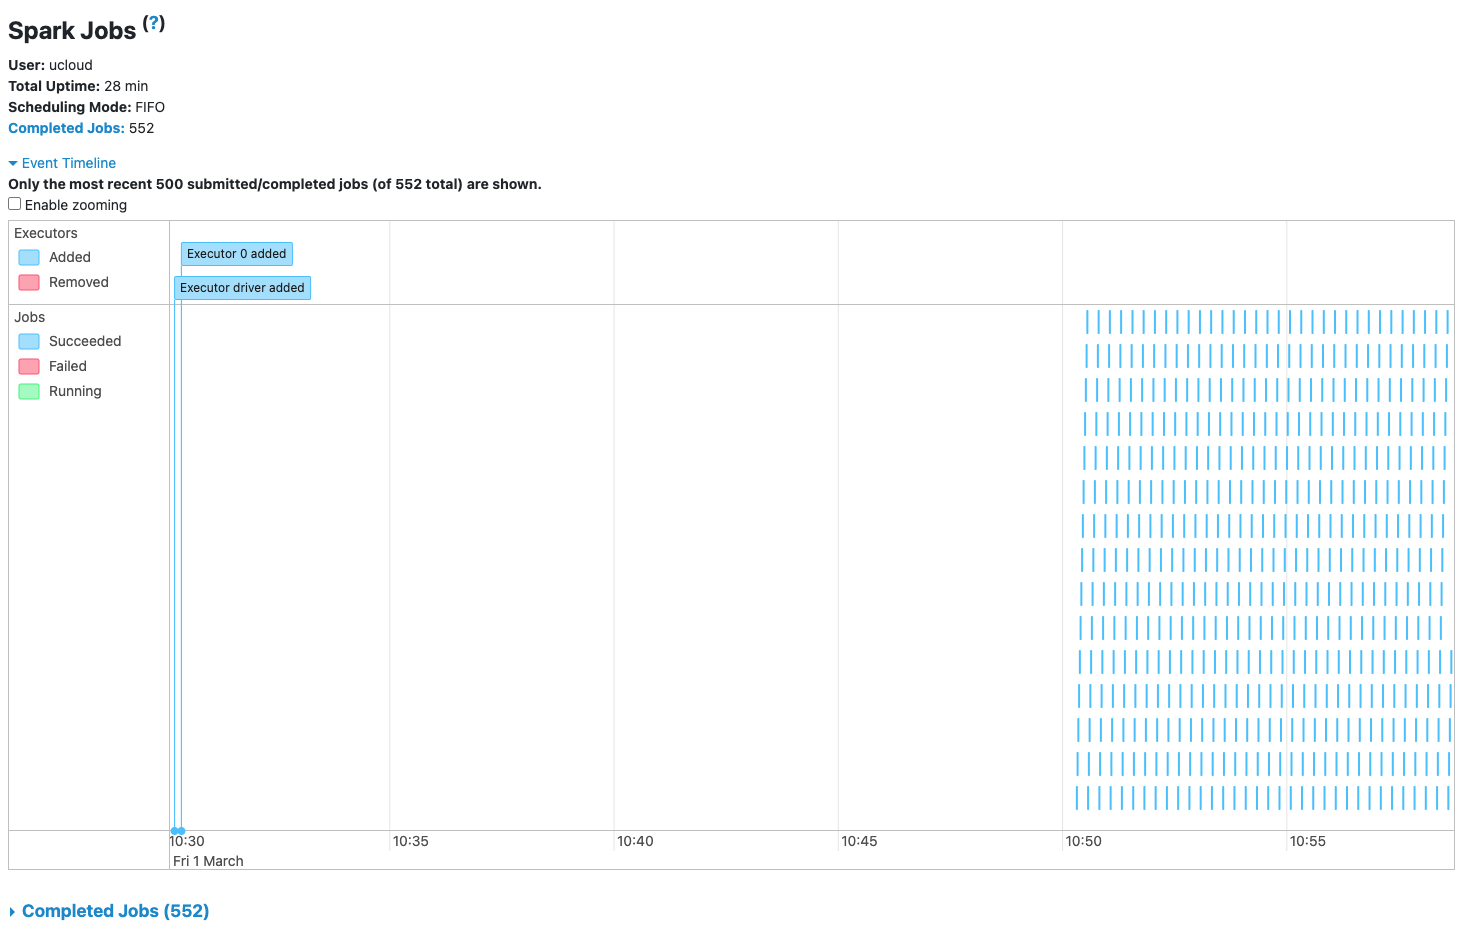
The StreamingDetectionAnomaly application is now accessible directly from the Spark UI:
NGINX Integration: Gateway for Data Streaming
Configure NGINX to act as a pivotal data routing mechanism, directing streams efficiently to the Spark analysis layer.
Start a new NGINX web server on UCloud with the optional parameters:
Connect to other jobs: Select the Job ID of the running Spark Cluster instance and specify a hostname.
Attach public IP addresses to your application: Add a public IP which will be used to route TCP requests from the data generator to the Spark application.
In the following we will use the configuration parameters:
Spark server hostname:
spark-app-serverPublic IP:
130.225.164.136
Stream directive setup
Adjust NGINX's settings (/etc/nginx/nginx.conf) to ensure a seamless stream direction towards the Spark application.
worker_processes  auto;

error_log  /var/log/nginx/error.log notice;
pid        /var/run/nginx.pid;

events {
    worker_connections 1024;
}

stream {
    upstream spark_backend {
        server spark-app-server:9999;  # Replace with Spark app's host and port
    }

    server {
        listen 8080;           # Listen on IPv4
        listen [::]:8080;      # Listen on IPv6
        proxy_pass spark_backend;
    }
}
Apply and verify these changes to initiate the data routing process:
$ nginx -t
$ nginx -s reload
Data Generation: Simulating Energy Network Inputs
Emulate an energy network data flow, employing a Python script to generate and direct data towards the NGINX gateway.
Ingest simulated data
Create a simple data generator to simulate ingestion of energy network data and anomalies from a remote server.
# data-simulator.py
import socket
import time
import json
from datetime import datetime
import random

def generate_data():
    """Generate data with a specific structure."""
    current_time = datetime.now()
    energy_usage = random.uniform(50.0, 150.0)  # Random energy usage
    data = {
        "timestamp": current_time.strftime("%Y-%m-%d %H:%M:%S"),
        "energy_usage": energy_usage
    }
    return json.dumps(data)

def send_data(host, port):
    with socket.socket(socket.AF_INET, socket.SOCK_STREAM) as sock:
        try:
            sock.connect((host, port))
            print(f"Connected to {host}:{port}")
            while True:
                data = generate_data()
                print(f"Sending: {data}")
                sock.sendall(data.encode('utf-8') + b'\n')
                time.sleep(1)
        except ConnectionRefusedError:
            print(f"Connection to {host}:{port} refused. Make sure the Spark application is running and listening on the port.")
        except BrokenPipeError:
            print("Connection broken. It seems the server closed the connection.")
        finally:
            sock.close()

if __name__ == "__main__":
    nginx_host = '130.225.164.136'  # NGINX server public IP
    nginx_port = 8080  # NGINX server and public IP port
    send_data(nginx_host, nginx_port)
Replace the NGINX public IP with the address allocated in your running job instance.
Open a terminal window on your local host and execute the script, simulating a consistent data stream into the architecture:
$ python3 data-simulator.py
Tip
Connected to 130.225.164.136:8080
Sending: {"timestamp": "2024-03-01 10:49:26", "energy_usage": 96.63672702481784}
Sending: {"timestamp": "2024-03-01 10:49:27", "energy_usage": 52.67580060984939}
...
Verify data processing
Check that Spark application is processing incoming data from the Spark UI:
Check the database
Verify that anomaly detection data is ingested into the database from the PostgreSQL console:
SELECT * FROM anomalies LIMIT 10;
Tip
id | timestamp | energy_usage | anomaly
---+---------------------+-------------------+---------
67 | 2024-03-01 10:49:26 | 96.63672702481784 | f
68 | 2024-03-01 10:49:27 | 52.67580060984939 | f
69 | 2024-03-01 10:49:28 | 93.58373839493248 | f
70 | 2024-03-01 10:49:29 | 84.93459675609593 | f
71 | 2024-03-01 10:49:30 | 93.67996038597265 | f
72 | 2024-03-01 10:49:31 | 99.52943818138002 | f
73 | 2024-03-01 10:49:32 | 97.27706150016957 | f
74 | 2024-03-01 10:49:33 | 135.45167262911912 | t
75 | 2024-03-01 10:49:34 | 126.18114890899919 | t
76 | 2024-03-01 10:49:35 | 98.26561458051634 | f
(10 rows)
Streamlit Dashboard: Visualizing Insights
Implement a Streamlit application running on UCloud to dynamically visualize the processed and stored data, enhancing data interpretability.
Connect to the database
Connect to the running PostgresSQL database instance using the Connect to other jobs optional paramter.
Below we will assume postgres-server as the PostgreSQL hostname.
Install dependencies
Use the Initialization optional parameter to install the Streamlit app dependencies:
# requirements.txt
psycopg2-binary
pandas
plotly
Import app main file
The Streamlit dashboard app is configured to fetch 100 data points every 15 minutes:
# dashboard.py
import streamlit as st
import pandas as pd
import psycopg2
import plotly.graph_objects as go
from datetime import datetime, timedelta
DB_HOST = 'postgres-server'
DB_NAME = 'ucloud'
DB_USER = 'ucloud'
DB_PASS = 'ucloud'
def load_data():
now = datetime.now()
time_15_min_ago = now - timedelta(minutes=15)
formatted_now = now.strftime("%Y-%m-%d %H:%M:%S")
formatted_time_15_min_ago = time_15_min_ago.strftime("%Y-%m-%d %H:%M:%S")
conn = psycopg2.connect(dbname=DB_NAME, user=DB_USER, password=DB_PASS, host=DB_HOST)
sql = f"""
SELECT * FROM anomalies
WHERE timestamp BETWEEN '{formatted_time_15_min_ago}' AND '{formatted_now}'
ORDER BY timestamp DESC
LIMIT 100;
"""
df = pd.read_sql_query(sql, conn)
conn.close()
return df
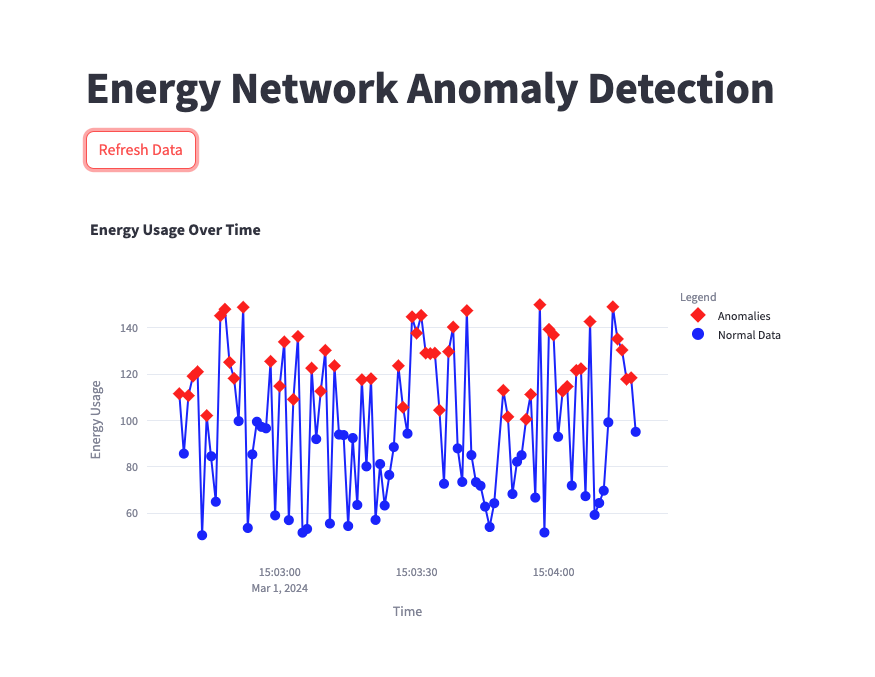
st.title('Energy Network Anomaly Detection')
# Button to refresh data
if st.button('Refresh Data'):
df = load_data()
else:
df = load_data() # Load data on initial app load as well
if not df.empty:
fig = go.Figure()
# Add line for all points
fig.add_trace(go.Scatter(x=df['timestamp'], y=df['energy_usage'], mode='lines+markers',
name='Energy Consumption',
line=dict(color='blue'),
showlegend=False,
marker=dict(size=10,
color=['red' if anomaly else 'blue' for anomaly in df['anomaly']],
symbol=['diamond' if anomaly else 'circle' for anomaly in df['anomaly']])))
# Update layout
fig.update_layout(title='Energy Usage Over Time',
xaxis_title='Time', yaxis_title='Energy Usage',
legend_title='Legend',
legend=dict(itemsizing='constant'))
# Custom legend
fig.add_trace(go.Scatter(x=[None], y=[None], mode='markers',
name='Anomalies',
showlegend=True,
marker=dict(color='red', size=12, symbol='diamond')))
fig.add_trace(go.Scatter(x=[None], y=[None], mode='markers',
name='Normal Data',
showlegend=True,
marker=dict(color='blue', size=10, symbol='circle')))
st.plotly_chart(fig)
else:
st.write("No anomalies detected in the latest data.")
The file dashboard.py must be located in the folder imported in the Streamlit app.
Visualize the results
After launching Streamlit, open the app web interface to view the power consumption data and anomalies.
Conclusion: Insights and Integration
This comprehensive guide underscores the creation and integration of a data architecture capable of handling, processing, and visualizing data in real-time on UCloud. By leveraging NGINX, Apache Spark, PostgreSQL, and Streamlit, you can develop a resilient pipeline that not only processes streaming data efficiently but also provides actionable insights through interactive visualizations.
Contents