Monitor a Job
After submitting the job, users are directed to the job progress view page.
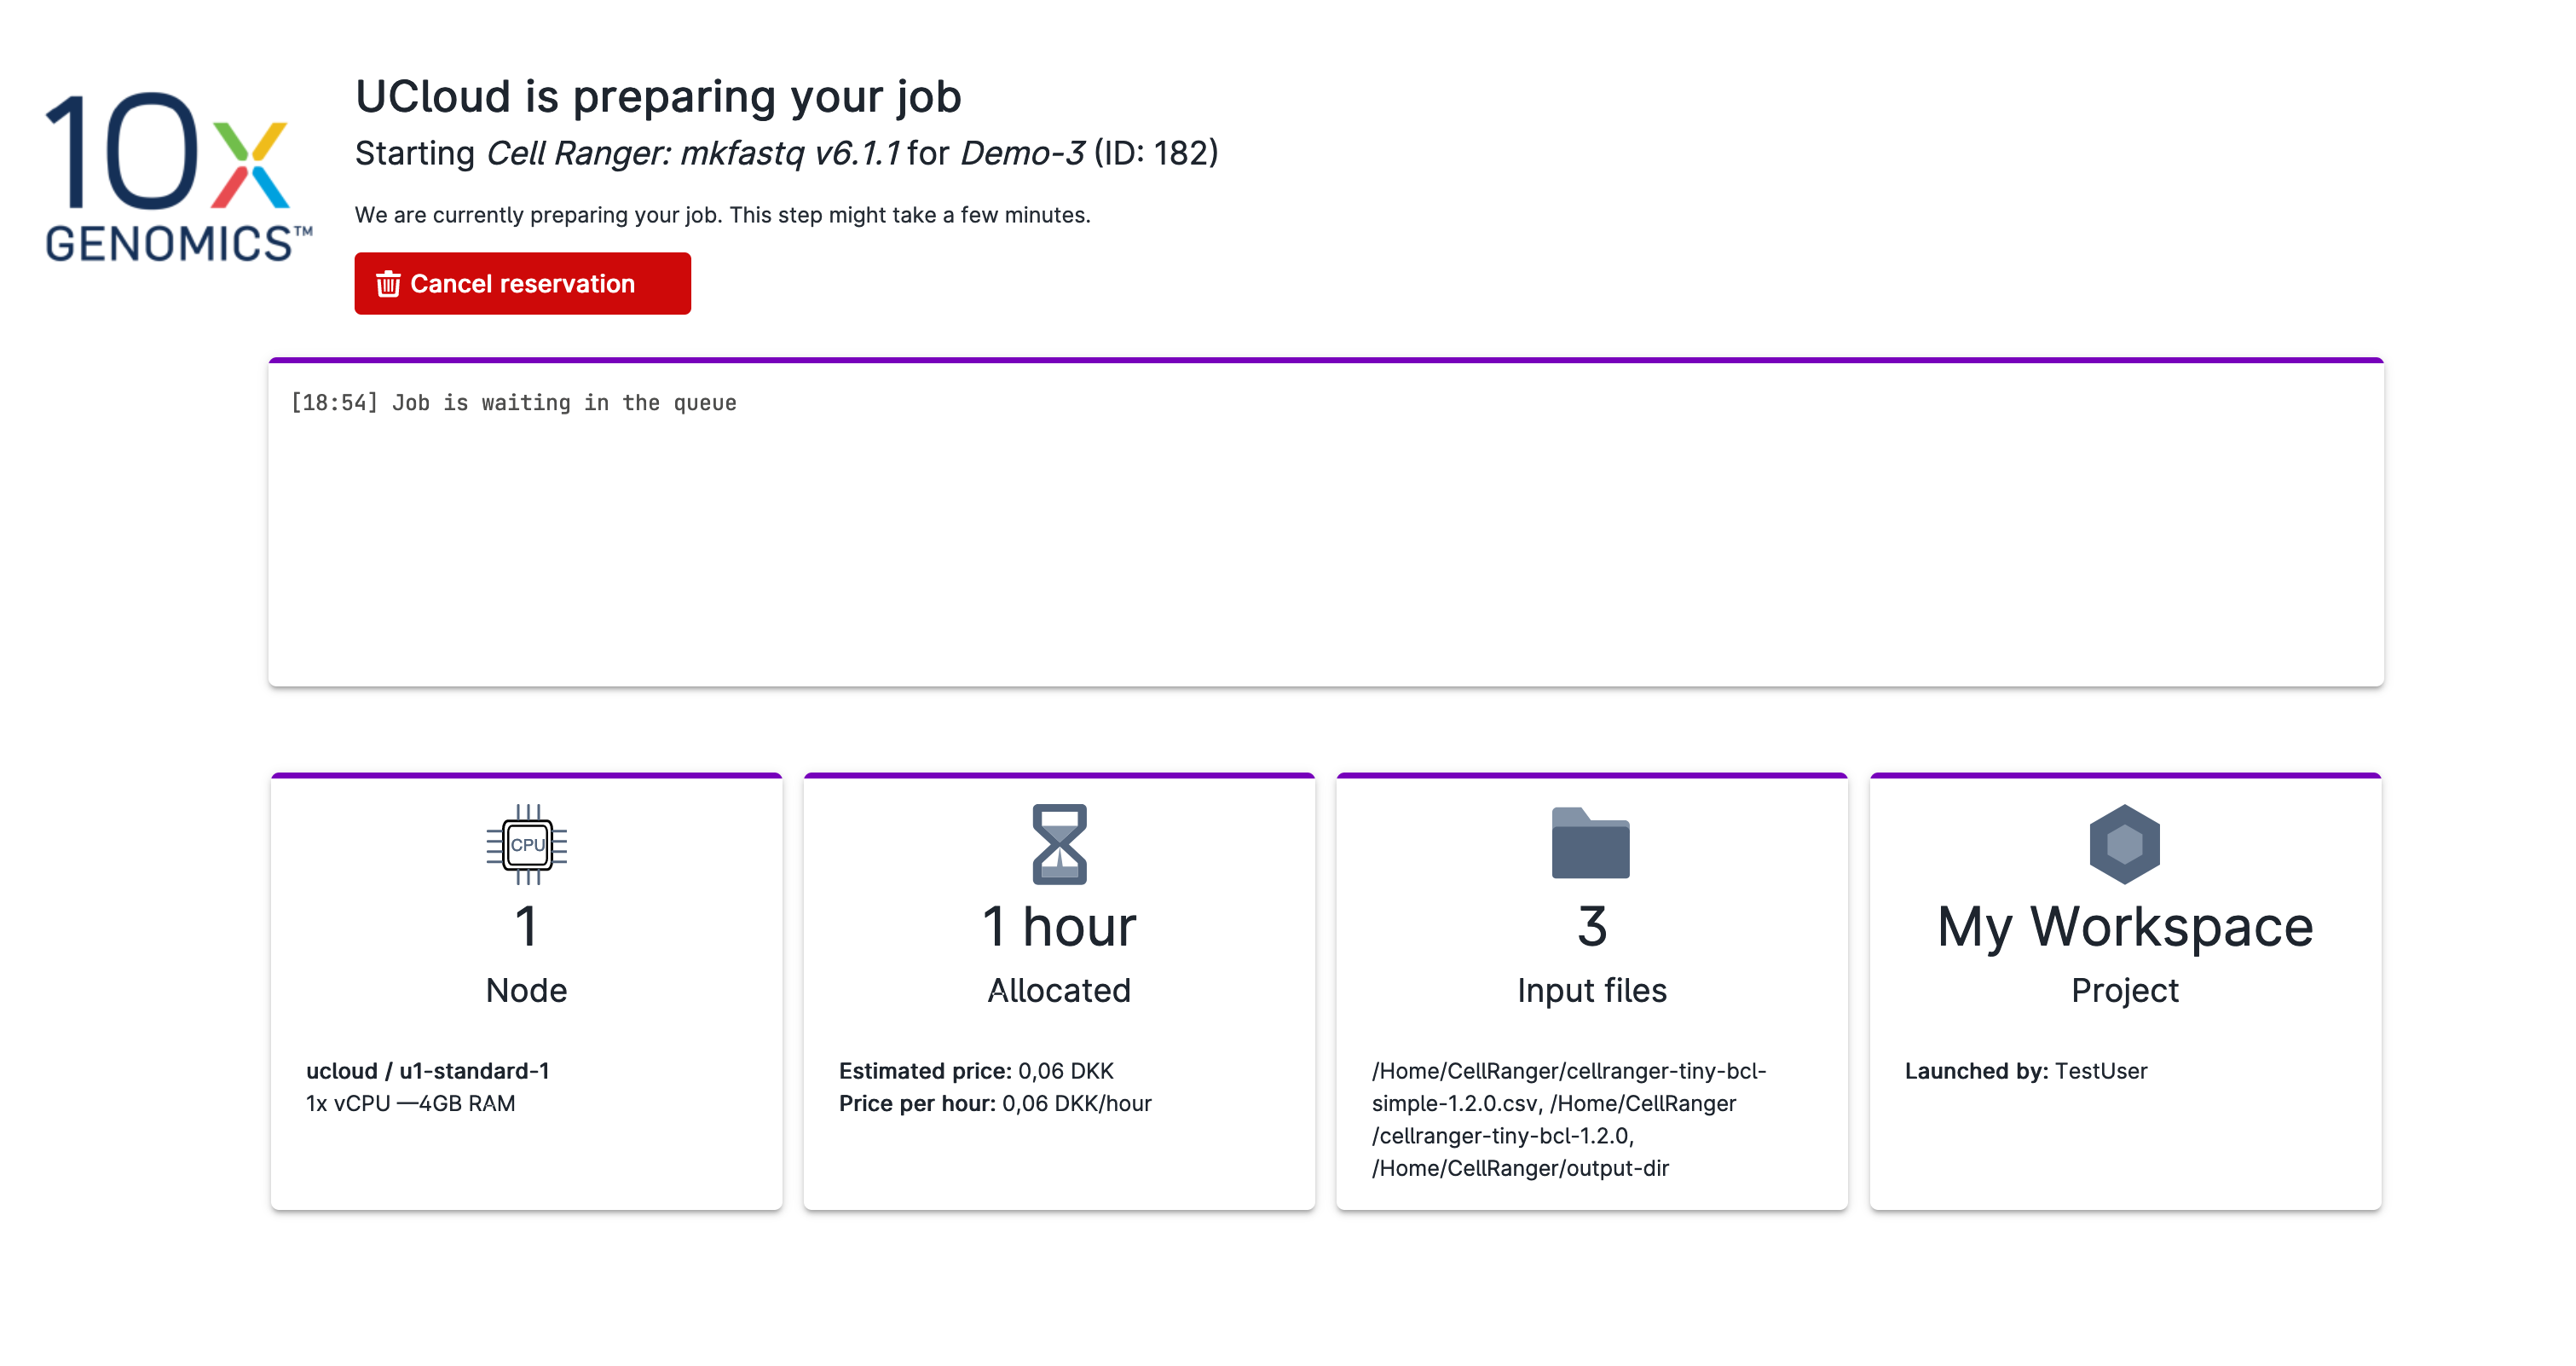
Job Scheduled
While the job is still in the queue, none of the allocated computational resources are utilized. The progress view page in this case appears as shown in the image below.

Users can remove the job from the queue before the run starts by clicking the
button.
Job Running
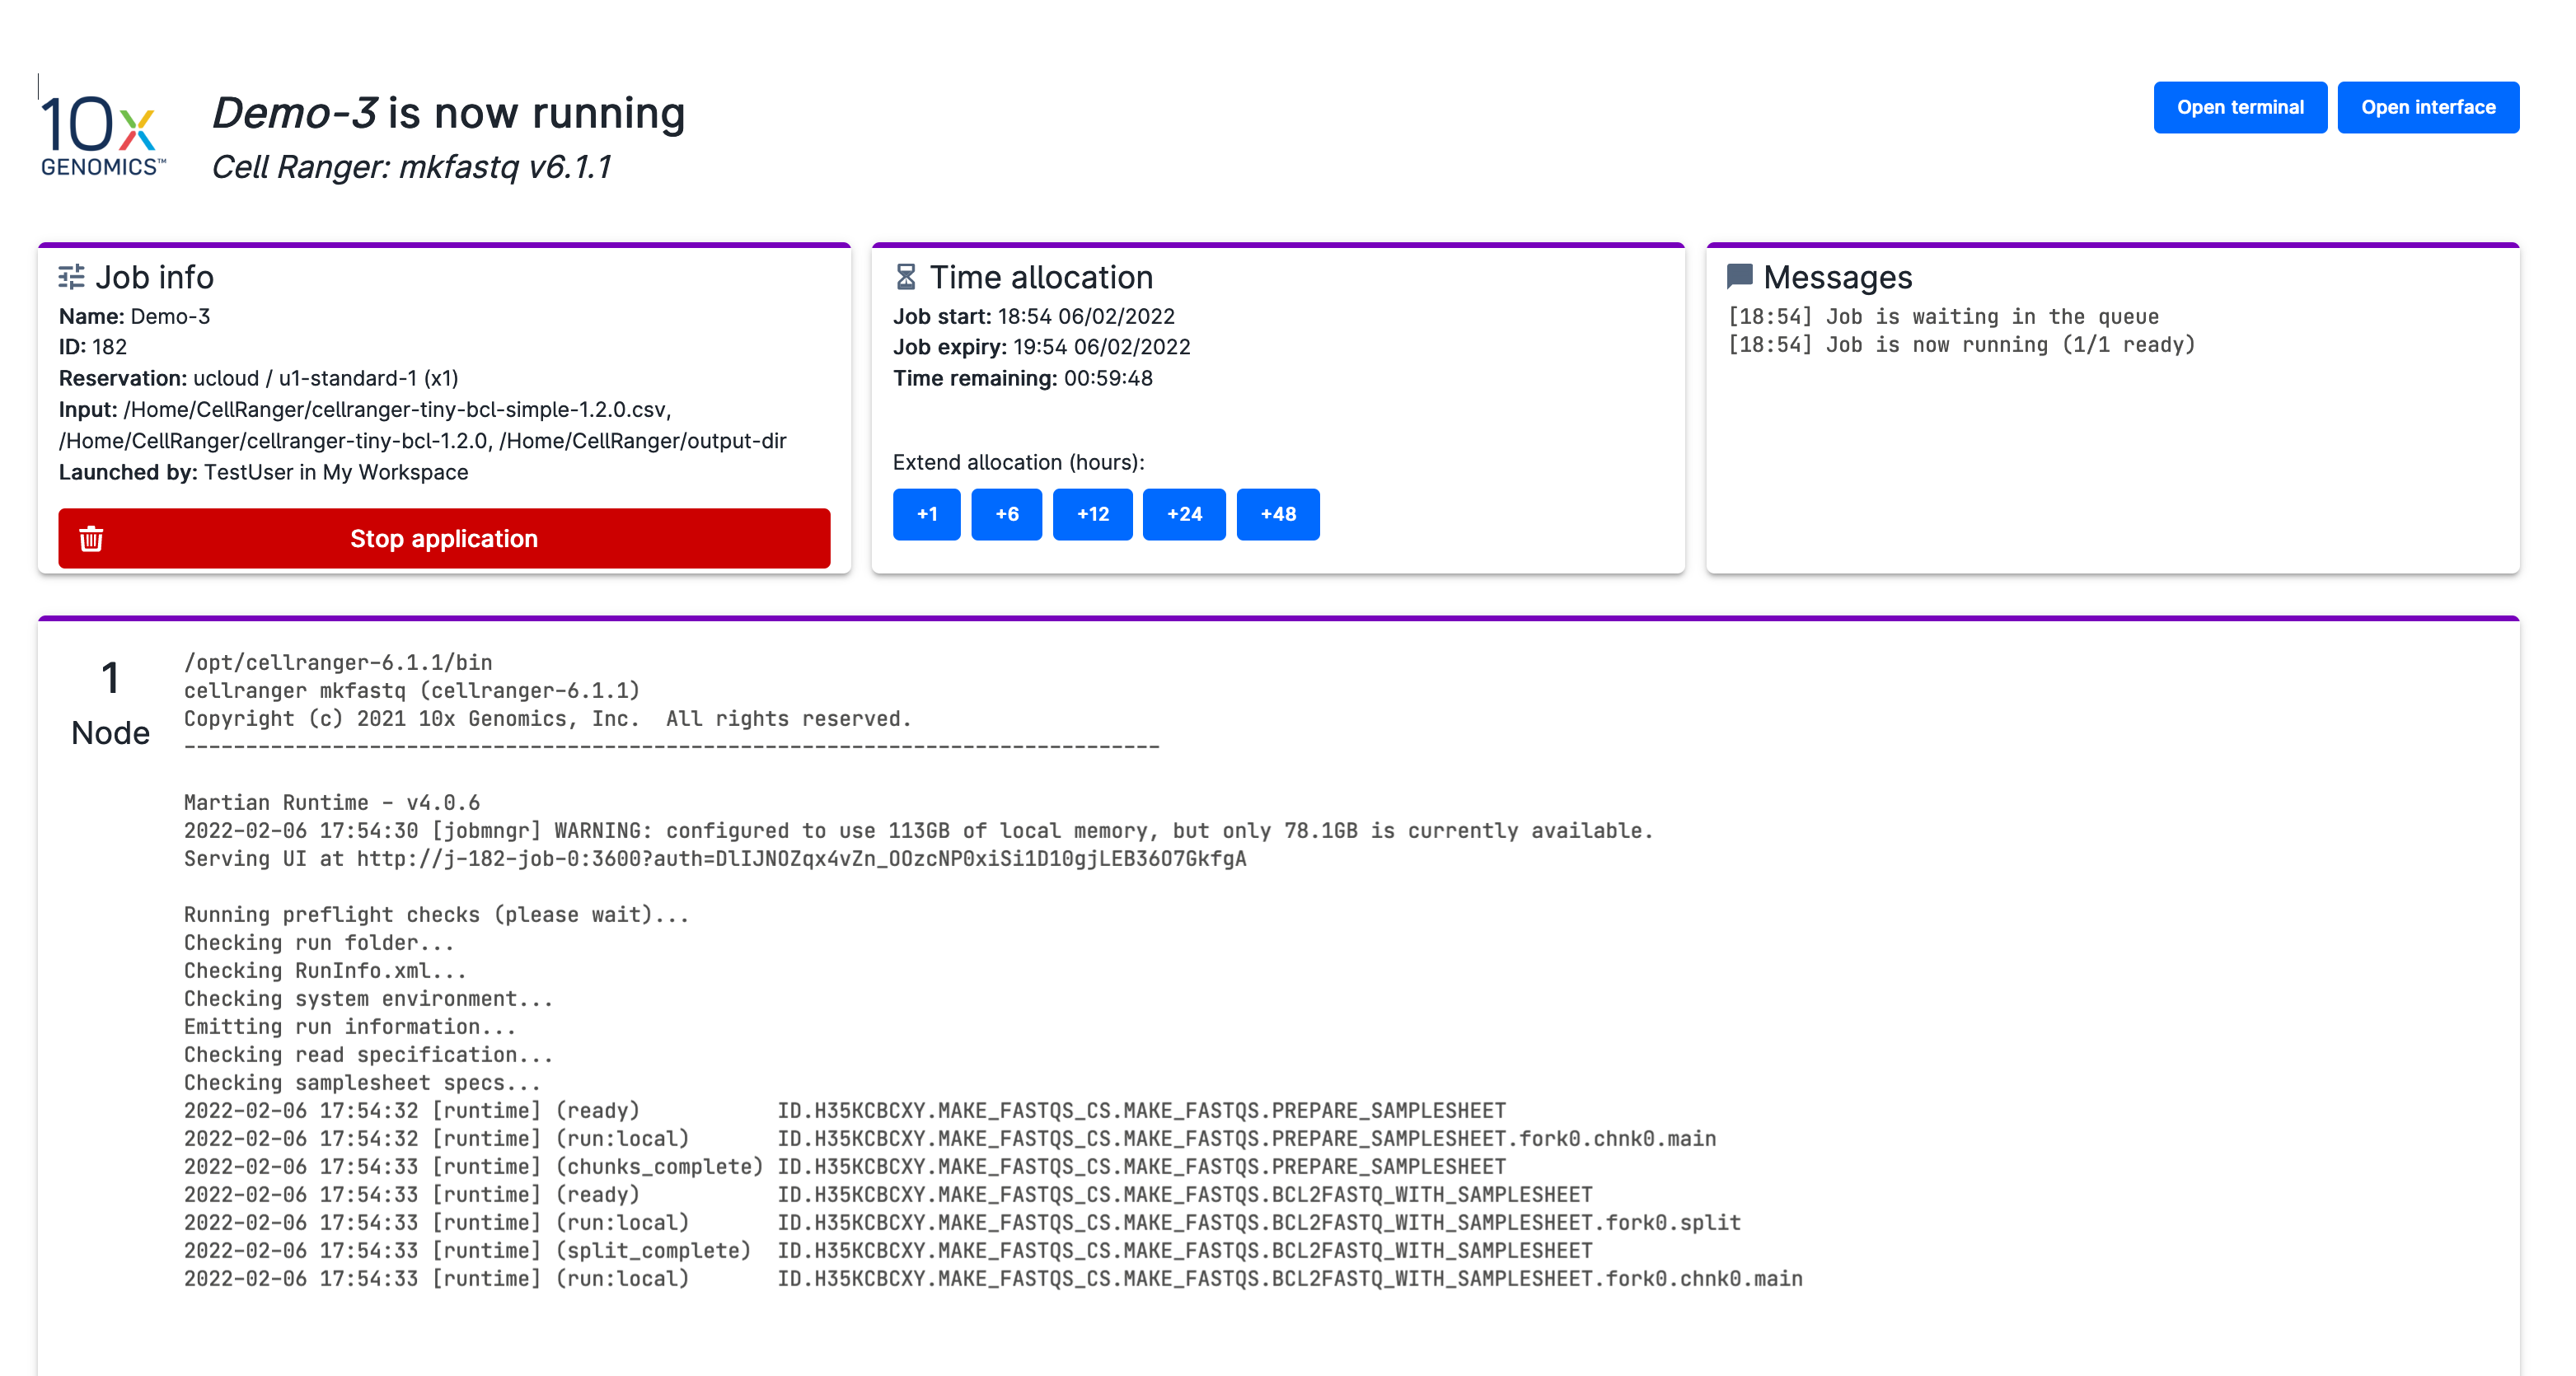
After the job status is set to running, the progress view page is split into different panels, as depicted below.

From these panels, users can view various information about the running job. For instance, users can extend the job lifetime at any moment during the run by selecting a certain amount of hours from the Time allocation panel.
Users can also terminate the job before the time limit is reached by using the
button. Additionally, while the job is running, users can open a terminal interface within the app by clicking on
Depending on the app type, users may also have the option to open a custom software graphical interface.
Important
UCloud performs accounting at regular intervals during the job lifetime. If users run out of credits before job completion, the jobs will be terminated.
If the job has been started with SSH enabled and/or public links, the SSH command and links are displayed under the SSH and Links tab in the top-right panel (see image above).
Monitoring job resource usage
The top-right panel of the job progress view displays widgets that show the job’s CPU, memory, network, and, if available on the node, GPU and GPU memory usage in real time. Depending on the application, additional widgets may also be available.

By using the buttons in the top-right corner of the panel, users can interact with the different usage graphs.
The is used for panning. The button zooms in whereas the button zooms out. Furthermore, users can zoom in on a specific part of the graph by clicking the and selecting the desired section of the graph with the mouse. The current zoom can be reset with the button.
Users can also export the different usage graphs and the underlying data. By clicking the button users can choose to export the graph as an SVG, PNG or CSV. Note that the PNG export option only exports the image of the graph whereas the CSV option only exports the underlying data points.
Note
The data points for the different usage graphs are stored in /work/.ucviz_data which is also available after job completion from the job completion page.
Job Completed
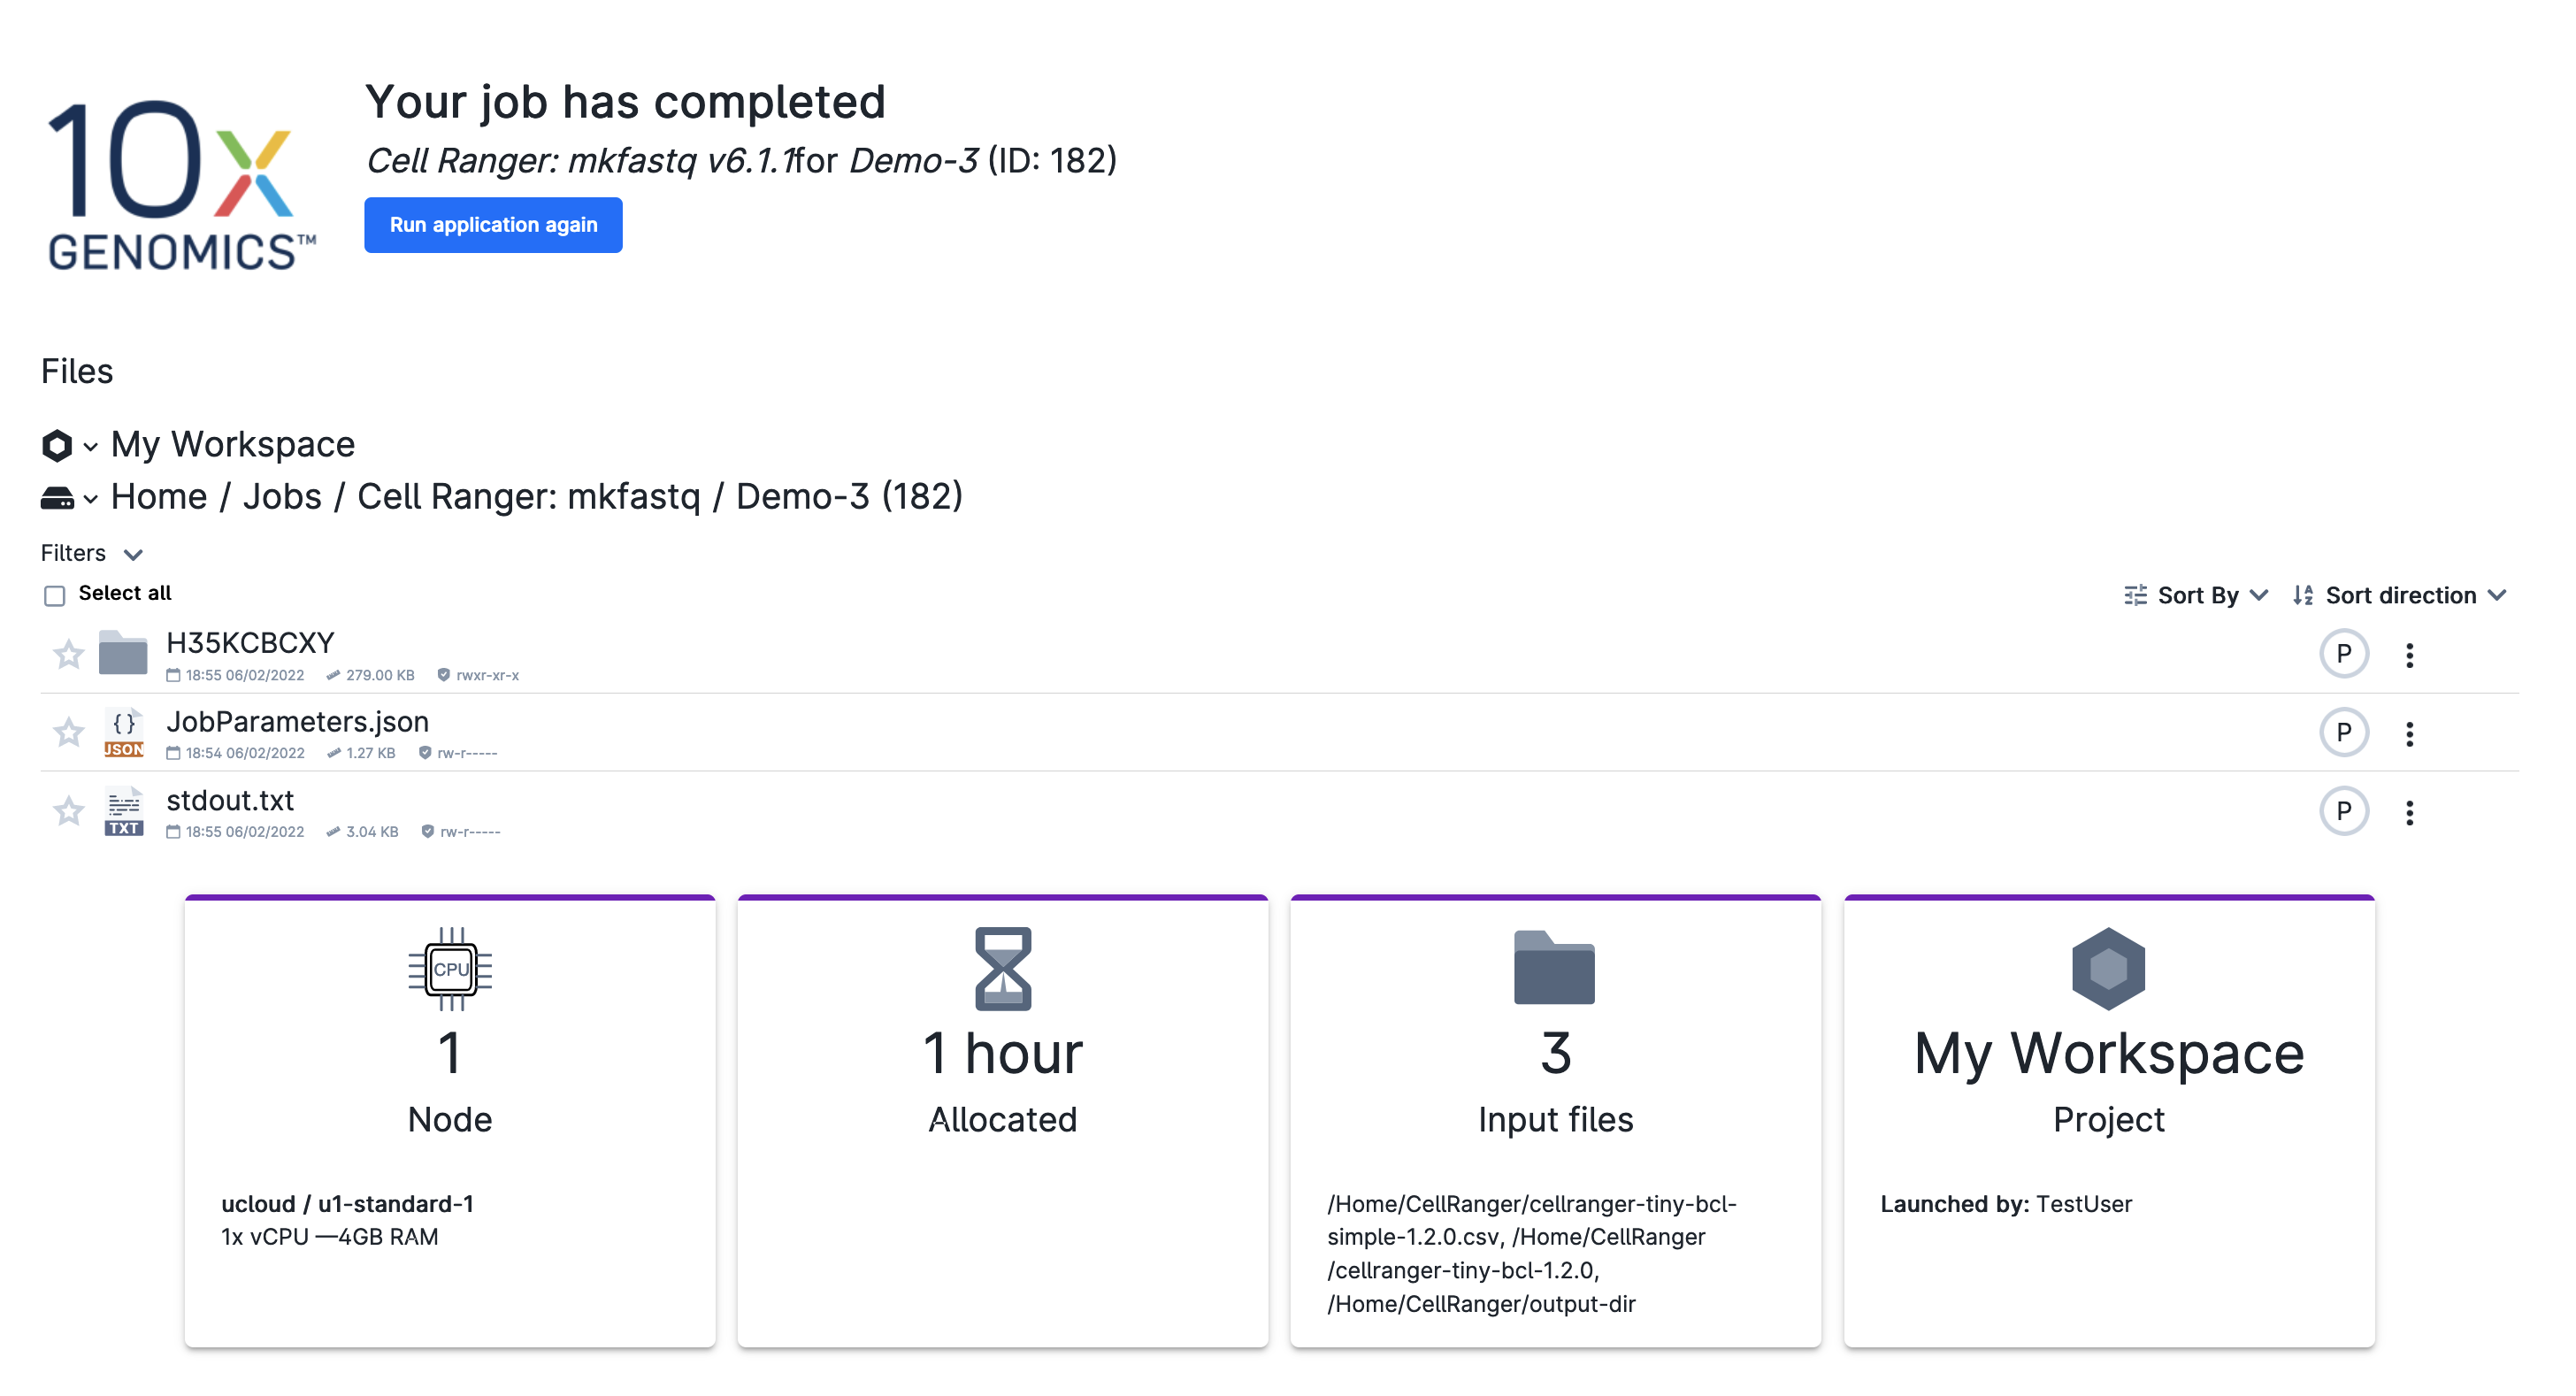
Once the job is completed, the path to the job output folder, with the associated link, and the job results will be available on the progress view page:

The job output folder is also reachable in the Jobs directory.
In addition to the job output files, five files are generated:
stdout.txt: This file replicates the program's standard output. It can be helpful for debugging in the case of a failure run.
run.JobParameters.json: This file contains a record of the parameter values used to submit the job. It is written in JSON format (see here for an example). The JSON configuration file is utilized to load all job options simultaneously.job-0.sh: This file contains the command which is used in the UCloud backend to start the job. The file is usually not directly relevant for users..ucviz-ui: This file contains the code used to generate the different widgets shown in the top-right panel of the job progress page. The file is hidden since it's usually not directly relevant for users..ucviz-data: This file contains the raw data displayed in the different widgets on the job progress page. The file is hidden since it's usually not directly relevant for users.
From this page, users can modify the content of the job output folder (by uploading files or creating new folders) and/or perform various operations (such as renaming, downloading, deletion, etc.) on the job output files. This can be done by clicking on a file and selecting the desired operation.
Finally, users can rerun the application with the same parameter values by clicking on the
button.
Contents