ElasticSearch
To help make our metadata on files and applications searchable and to keep our logging information we use Elasticsearch. This is done by having two separate Elasticsearch clusters: One for logs and another for metadata.
Metadata Searching
We mainly use our metadata on applications to enable quick and efficient searching.
Applications
When an application is created name, version, title and tags are also created in the application index of our metadata Elasticsearch cluster. This information is used to enable advanced search of applications in an efficient manner. Just as with files, any update to an application would also be seen in the index.
Logging/Audit
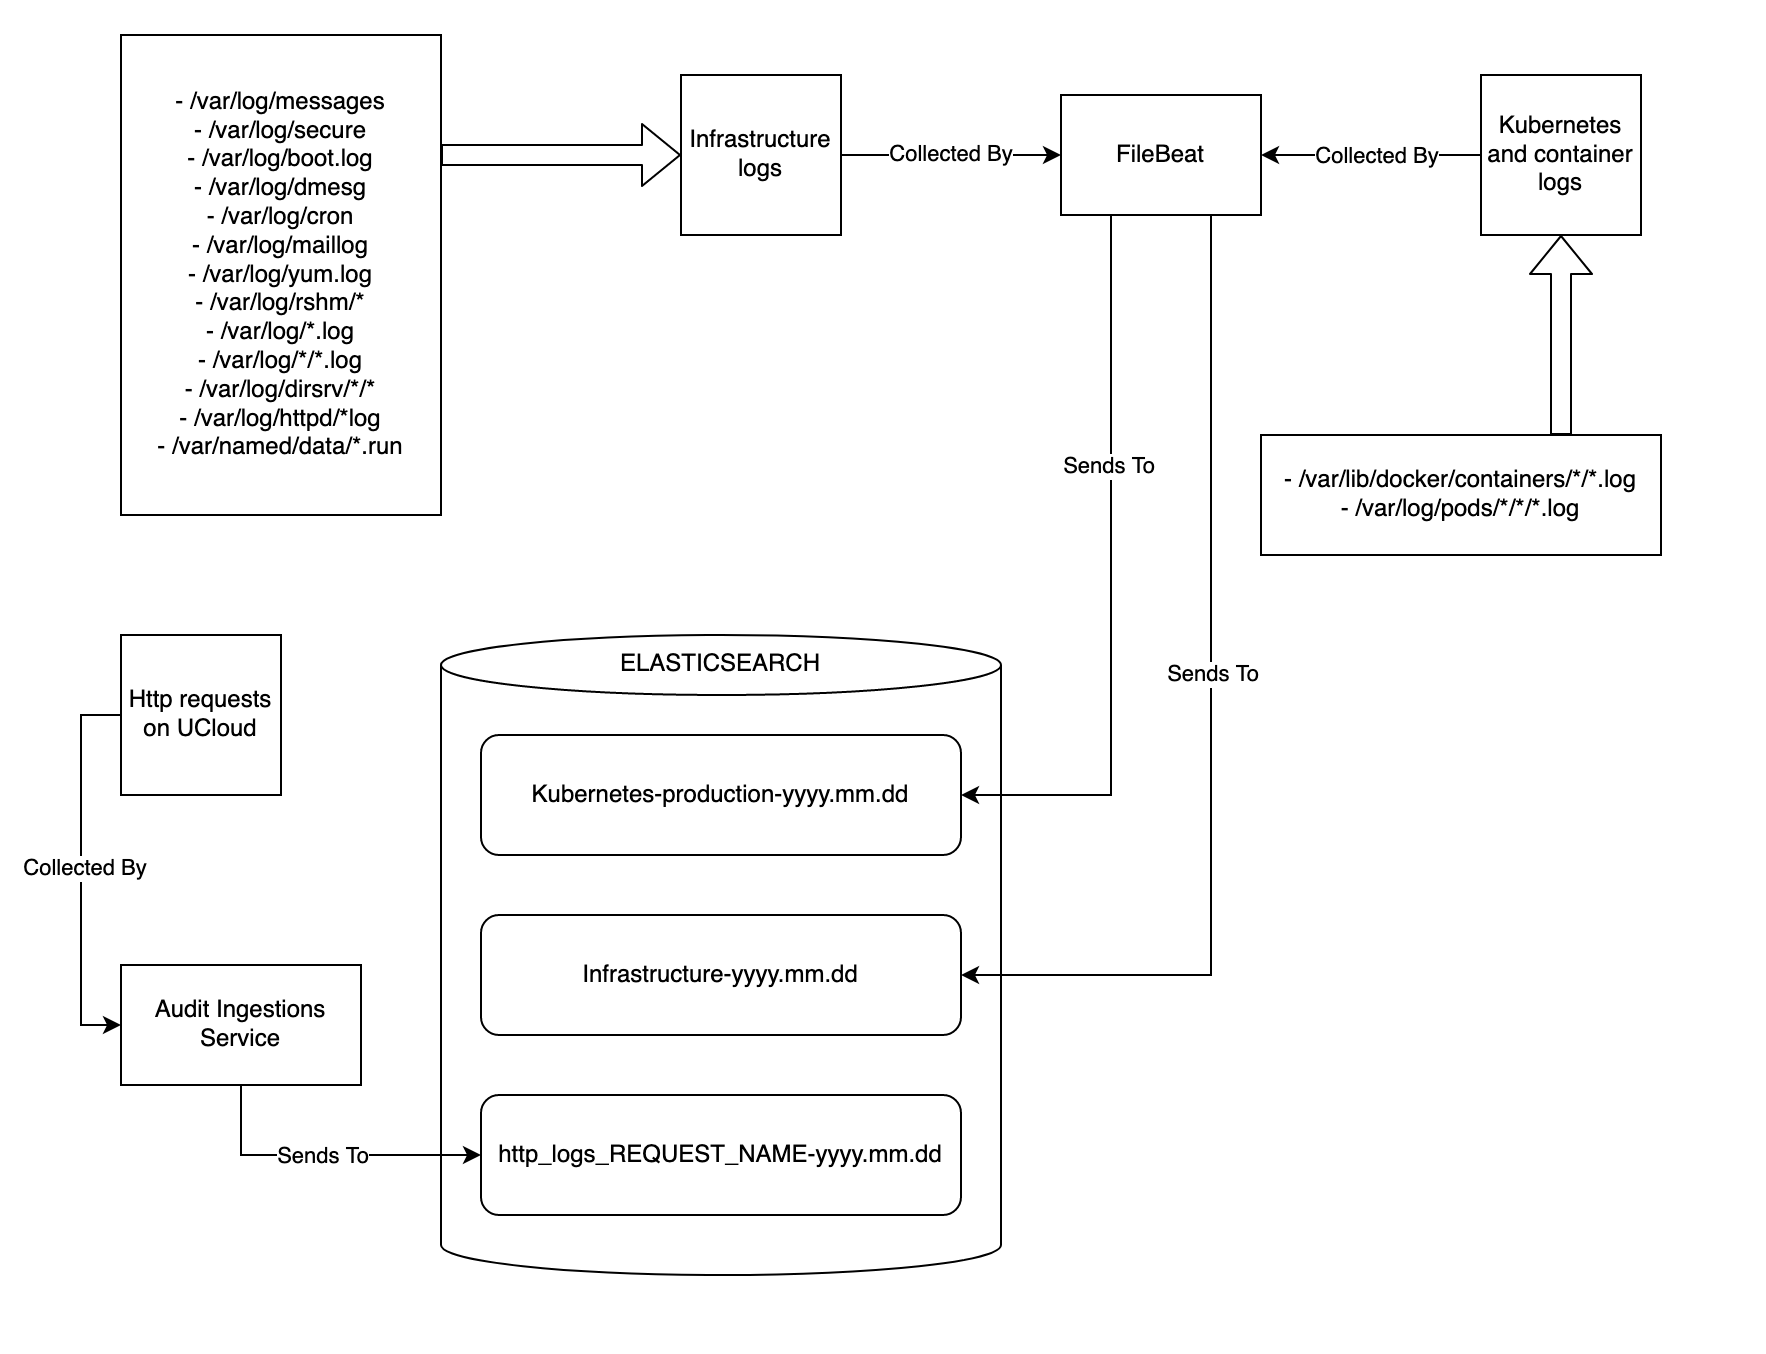
All logging/Auditing resides in a single Elasticsearch cluster that only contains logs. We are receiving logs through “three” different channels (see figure below).
All audit logs created when users are using the cloud service
All system logs from each of the nodes connected to the cluster
All
stderr/stdoutfrom each pod running in the kubernetes cluster
Cloud Service Auditing Ingestion
The audit logs are created by the users preforming actions on the cloud service and thereby creating events. These events are stored in Redis. The Audit Ingestion Service then collects these events and places in their respective index.
Node Log Ingestion
Each node in the cluster have a Filebeat instance installed. The Filebeat checks the predetermined log files on the nodes. If the log file changes, this change is collected by Filebeat and forwarded to the Elasticsearch cluster.
Pod Log Ingestion
To get the logs from our pods on Kubernetes, we use Filebeat as well. An instance on each node collects logs from each pod running on that particular node. These logs are then forwarded to the Elasticsearch cluster.
Data Retention and Automated Curation
By using our own Elasticsearch Management Tool are we able to keep our shard and indices consumption at a minimum. A daily scan is run to reduce the number of shards in the audit logs for the previous day to 1 primary shard and 1 replica shard per index. This would usually mean that indexing and search speed would decrease, however since this is the logs for the previous day then the need of indexing is no more and search does not have to fast. On top of this shrinking process we also do a reindex to a monthly index of week old indices. By doing this we reduce the former weeks daily indices into a single monthly index continually.
During the daily scan we also check old logs to see if any of them have expired according the predetermined retention period. If the entire index only contains expired logs, then the entire index is delete, otherwise it would only be the specific logs that are deleted. This gives us the ability to have a fine granularity if some logs needs to be kept longer than other logs.
Last but not least we do an aliasing of the 7 last days of logs. All these indices will now be included in search when we search the “Grafana” index. This makes search and response time of Kibana much faster since it does not look in the last 180 days of logs but instead only the last 7 days.
Upgrade Procedures
The person responsible for Elasticsearch should be on the Elasticsearch e-mailing list. If a new version is released, it would be necessary to upgrade the deployed clusters. This is done by first upgrading the master nodes, then the client and finally the data nodes. This procedure is done manually. The nodes should be removed and added one at a time and be allowed to rejoin the cluster before proceeding. When an update is applied, the Elasticsearch API used by the services should also be upgraded and in case of deprecation: Rewrite/update of codebase.
Security
The Elasticsearch cluster is protected by username and password. Different roles are given to the users so that they do not have access to more actions than necessary.
Kibana
Kibana is our dashboard for searching and navigating the large amount of logs that are generated. This is also username/password protected and the user also have different roles/privileges according to their needs. By using Kibana we can search logs for a given period in either the http_logs or the filebeat/node logs. It also gives us possibility to search the file and applications metadata.