Visualization of Usage

Visualization gives the user access to an overview of their usage during a set period or for a given product category. It also provides statistics to help understand workflows.
Usage
Usage is shown in different versions and only for a single product category at a time. When a usage request is made by the user usage for all product categories are collected and returned.
Usage over time chart
Usage over time shows the usage during the selected period for the selected product type
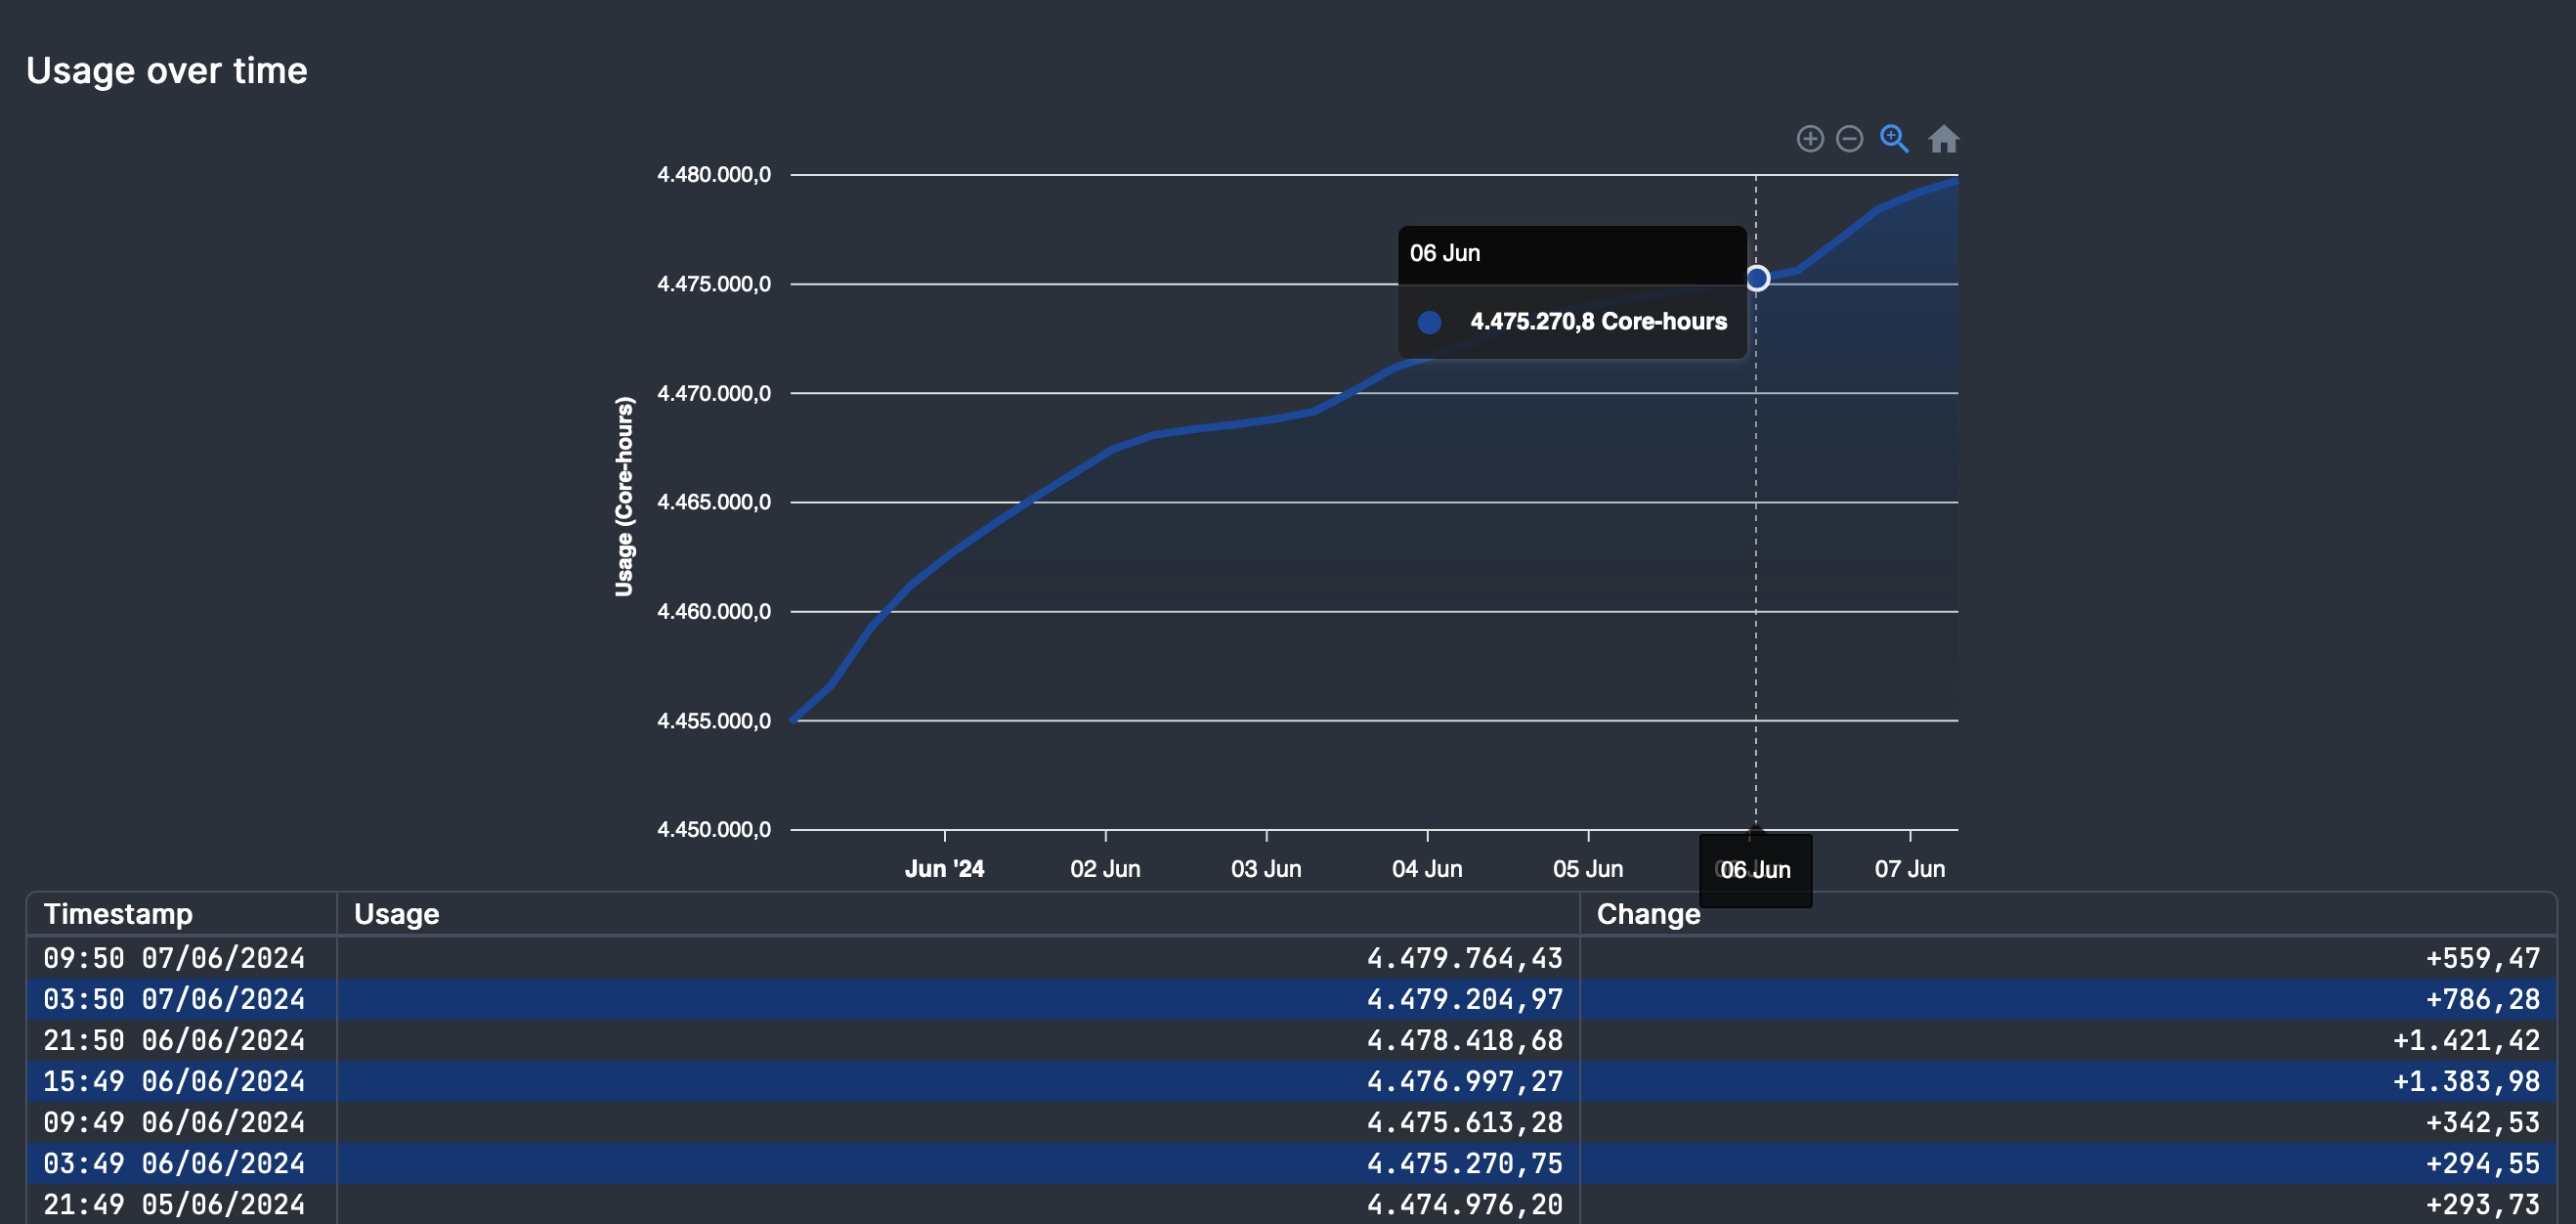
Figure 1: Full usage shown for product type u1_standard-h for the period of a week.
Usage breakdown by sub-projects
Usage breakdown shows the usage during the selected period for the selected product type divided into projects
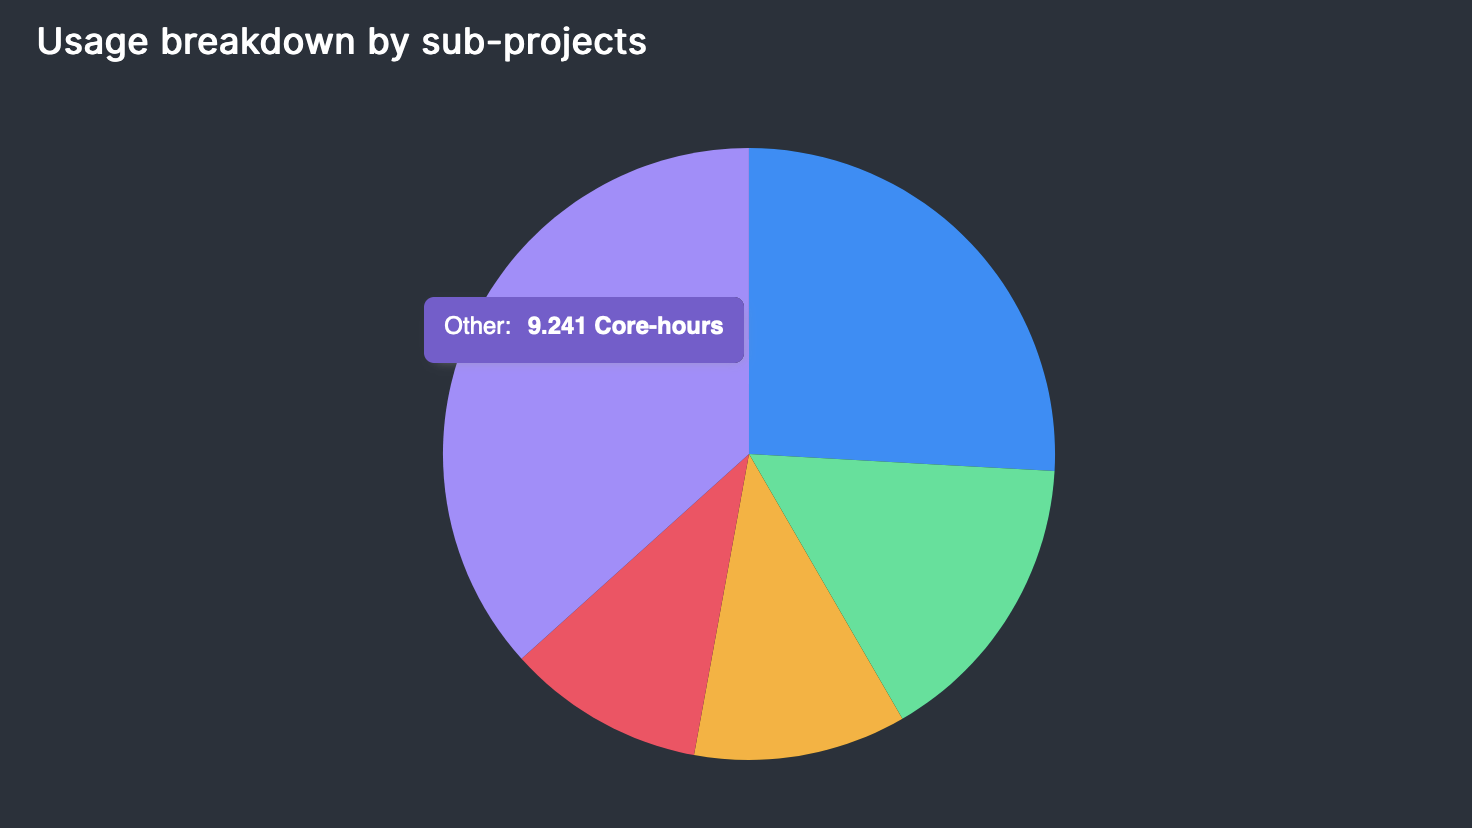
Figure 2: Usage shown for product type u1_standard-h for the period of a
week divided into top 4 projects and the rest bundled into other.
Statistics
Statistics offers insight into the subprojects workflows showing data regarding jobs.
Most used applications
The overview of most used applications shows a list of applications run by the subprojects of the current project sorted by frequency.
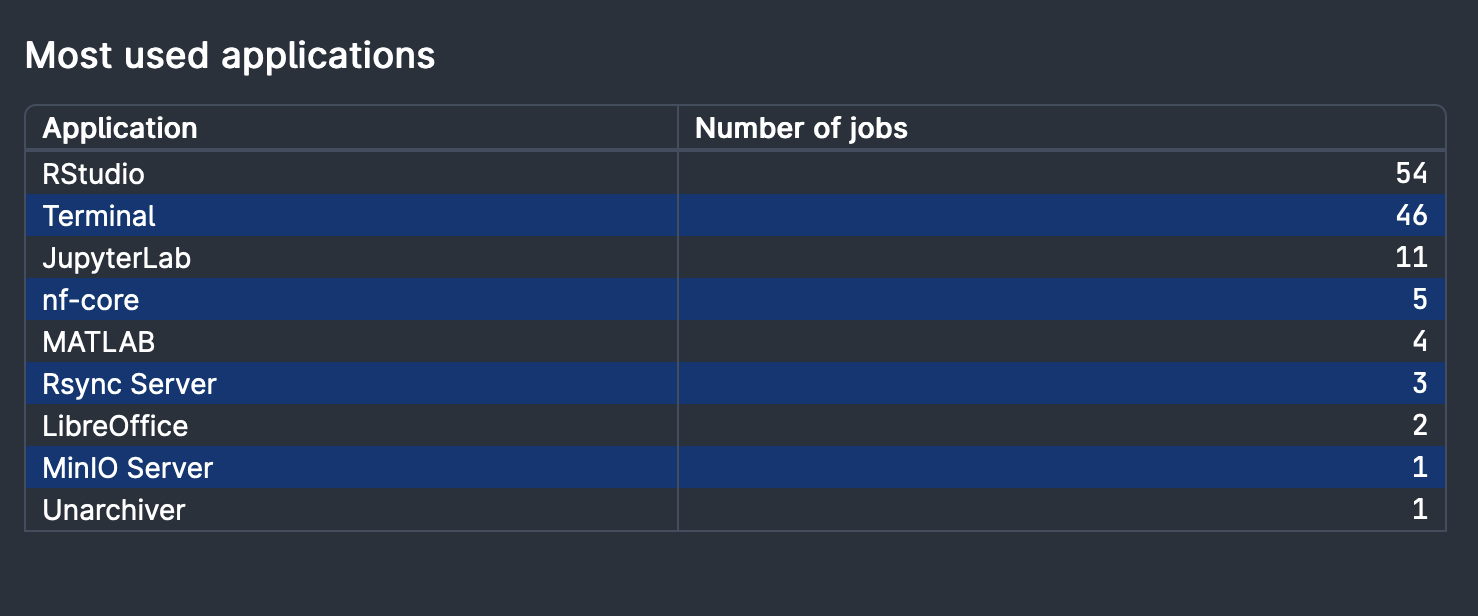
Figure 3: Overview of most used applications.
When are your jobs being submitted?
The overview of when jobs are submitted collects data on when jobs are started and presents it in 6 hour buckets
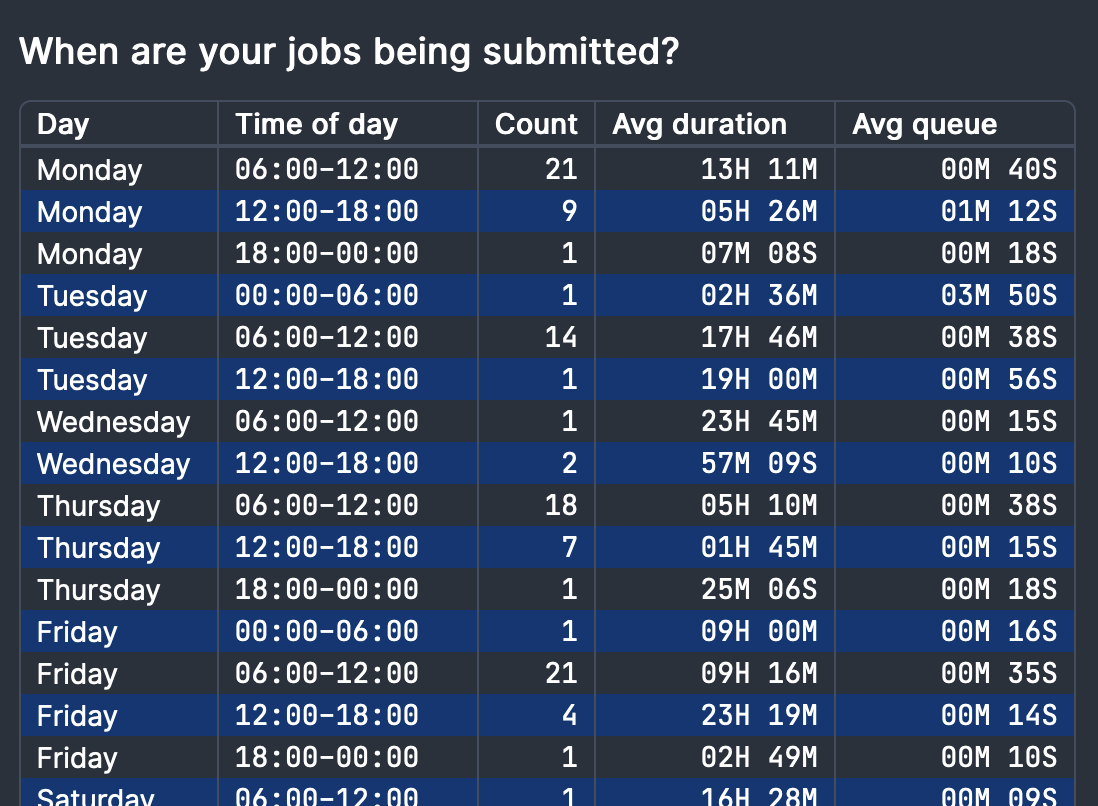
Figure 4: Overview of when jobs are being submitted.